

Leave Your Message
Choosing the right sensor for vibration analysis can feel like comparing seven nearly identical tools. Their housings may look similar, yet their frequency limits, sensitivity, noise floors, and mounting requirements can differ sharply. This guide examines the 7 Best Piezo Frequency Response Sensors in 2026 for engineers, technicians, researchers, and serious equipment testers.
Each selection is considered through practical criteria, including usable frequency range, charge or voltage output, calibration stability, environmental resistance, connector design, and installation method. A sensor mounted on a steel gearbox may respond differently from one fixed to a lightweight laboratory frame. Cable movement, surface preparation, temperature, and mounting torque can also distort measurements. Small details matter.
No sensor wins everywhere. Some models prioritize high-frequency accuracy, while others offer better durability for industrial monitoring. The most expensive option may not deliver the clearest result in every application. That deserves attention. Where specifications appear impressive, they should still be checked against independent test data, calibration certificates, and manufacturer documentation. This review also acknowledges practical limitations, including incomplete public measurements and performance differences between laboratory tests and field conditions. The goal is not to promote a single brand, but to support a defensible choice based on evidence, application needs, and long-term reliability. Expect useful comparisons, but verify critical figures before purchasing. Real equipment is less forgiving than a product sheet.
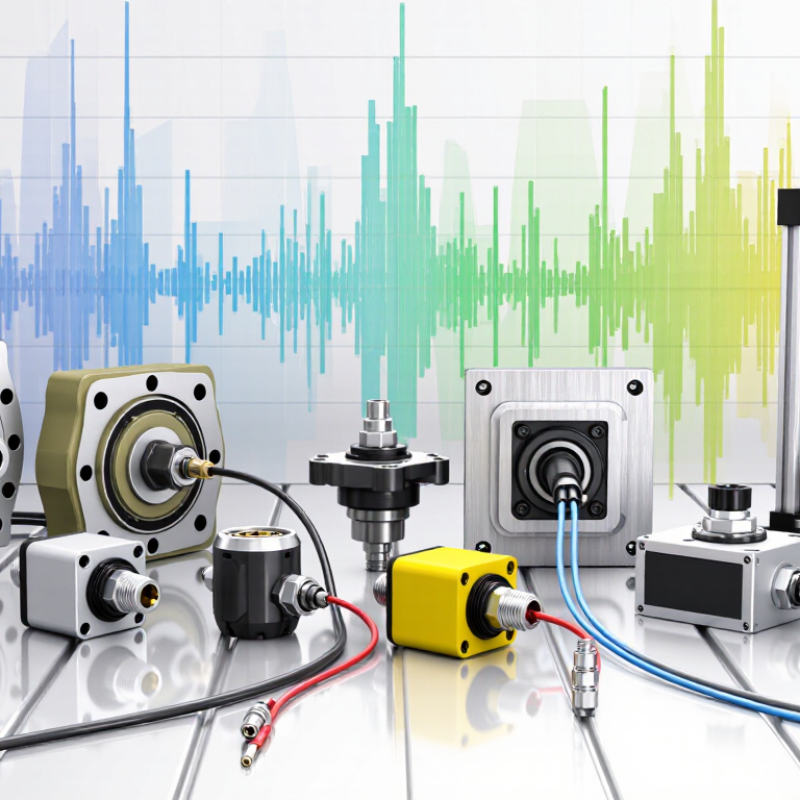
Piezo frequency response sensors measure how a structure reacts across changing frequencies. They detect dynamic force, vibration, pressure, and acceleration. Their output reveals amplitude, phase, resonance, damping, and unwanted harmonics. A sharp peak near 2.4 kHz may show a structural resonance. A phase shift can expose stiffness changes before visible damage appears.
The measurement matters because machines rarely fail at one steady frequency. Motors, pumps, aircraft structures, and medical equipment create complex vibration patterns. Engineers compare sensor data with baseline tests, often using calibration practices defined in ISO 16063-21. MarketsandMarkets reported that the global piezoelectric devices market could grow from about 31.4 billion dollars in 2023 to 43.3 billion dollars by 2028. That growth reflects wider demand for precise dynamic measurements. Still, market size does not guarantee measurement quality. Poor mounting can distort results.
Tips: Mount the sensor firmly and keep the cable secured. Check sensitivity, frequency range, and calibration date before testing. Use a frequency sweep rather than one fixed point. A 2024 report from Grand View Research also identified strong growth in piezoelectric applications through 2030, but field conditions remain less predictable than laboratory tests. Temperature, cable motion, and mounting stiffness can alter the response. I have seen clean-looking plots hide setup errors. That uncomfortable possibility deserves a checklist, not confidence alone.
| Rank | Sensor Type | Primary Quantity Measured | Typical Frequency Range | Typical Dynamic Range | Typical Sensitivity | Required Signal Conditioning | Best-Fit Applications | Main Advantage | Important Limitation |
|---|---|---|---|---|---|---|---|---|---|
| 1 | IEPE/ICP® Piezoelectric Accelerometer | Dynamic acceleration and vibration | Approximately 0.5 Hz to 10 kHz; precision designs can extend beyond 20 kHz | Typically ±50 g to ±500 g | Typically 10 to 100 mV/g | Constant-current excitation, voltage amplifier, and IEPE-compatible data-acquisition input | Machine condition monitoring, modal testing, automotive vibration, rotating equipment | Easy integration with modern acquisition systems and strong repeatability | Requires power through the signal cable and is less suitable for very high-temperature locations |
| 2 | Charge-Output Piezoelectric Accelerometer | Dynamic acceleration, shock, and vibration | Approximately 0.3 Hz to 30 kHz, depending on mounting and construction | Typically ±10 g to ±10,000 g | Typically 1 to 10 pC/g | Low-noise charge amplifier or remote charge converter | Shock testing, aerospace structures, engine testing, high-temperature vibration | Good cable flexibility and operation over a wide temperature range | More sensitive to cable noise, insulation leakage, and charge-amplifier setup |
| 3 | Miniature Piezoelectric Accelerometer | High-frequency vibration and transient acceleration | Approximately 1 Hz to 20 kHz | Typically ±100 g to ±500 g | Typically 1 to 10 mV/g | IEPE excitation or a compact charge amplifier | Small test articles, circuit boards, tool spindles, bearings, and lightweight structures | Low mass reduces test-object loading and preserves higher-frequency behavior | Lower sensitivity and greater handling sensitivity than larger sensors |
| 4 | High-Temperature Piezoelectric Accelerometer | Vibration and acceleration in hot environments | Approximately 1 Hz to 10 kHz | Typically ±50 g to ±1,000 g | Typically 1 to 10 pC/g | Charge amplifier with high-temperature cable and insulation system | Combustion systems, turbines, exhaust systems, furnaces, and engine test cells | Operates where conventional electronics cannot tolerate the temperature | Temperature changes can affect sensitivity, insulation resistance, and frequency response |
| 5 | Piezoelectric Film Vibration Sensor | Bending strain, vibration, impact, and acoustic activity | Approximately 0.1 Hz to 1 kHz for common bonded configurations; specialized designs may reach several kHz | Best suited to low-level to moderate dynamic strain rather than calibrated high-g shock | Usually specified as charge per strain or voltage per applied deformation | High-impedance voltage amplifier, charge amplifier, or low-noise buffer | Flexible structures, impact detection, wearables, acoustic monitoring, and distributed sensing | Very thin, lightweight, flexible, and easy to attach over a large area | Output depends strongly on bonding, bending geometry, temperature, and cable capacitance |
| 6 | Dynamic Piezoelectric Force Sensor | Dynamic force, compression, tension, or clamping force variation | Approximately 0.5 Hz to 10 kHz | Commonly 0.1 kN to 100 kN full scale, depending on geometry | Typically 1 to 10 pC/N | Charge amplifier or high-impedance measurement chain | Cutting-force measurement, press monitoring, impact testing, and structural load dynamics | High stiffness and excellent response to rapidly changing forces | Cannot provide reliable static-force measurement because charge leaks over time |
| 7 | Dynamic Piezoelectric Pressure Sensor | Rapid pressure fluctuations and combustion or acoustic pressure | Approximately 1 Hz to 100 kHz, depending on diaphragm design and installation | Commonly 0.1 MPa to 10 MPa full scale | Typically specified in mV/kPa, mV/bar, or pC/Pa | IEPE conditioner or charge amplifier, depending on sensor output | Engine-cylinder pressure, blast testing, fluid pulsation, combustion acoustics, and shock tubes | Very fast response for pressure spikes and high-frequency pressure waves | Installation, diaphragm resonance, thermal shock, and pressure-port geometry can alter the measured response |
Note: The specifications shown are representative engineering ranges for the sensor categories, not a guarantee for every individual device. Actual bandwidth, sensitivity, amplitude linearity, resonance frequency, temperature range, and calibration uncertainty depend on the sensing element, housing, mounting method, cable, signal conditioner, and test setup. Piezoelectric sensors are primarily intended for dynamic measurements and generally should not be used as direct substitutes for static force, static pressure, or DC acceleration sensors.